Engineering
From 7,811 draw calls to 23: making a browser BIM viewer run at 60 fps
How I took a browser BIM viewer from 19.6 to 60 fps on a laptop GPU, made picking 95× faster and cut the first download from 32 MB to 2.2 MB, without a game engine.
On this page
Christchurch Site Viewer is a demo I built to see how far a plain browser can go with real construction data: IFC building models placed on 1 m LiDAR terrain of central Christchurch, with an aerial image, 925 neighbouring buildings, sun shadows, measurement, section cuts and real-time collaboration.
The first working version ran at 19.6 fps on an Apple M3 laptop. The current one holds 60 fps (the display cap) on the same machine, picks elements about 95× faster, and downloads 2.2 MB instead of 32 MB before the first view. None of this needed a game engine. Here is what made the difference, in order of impact.
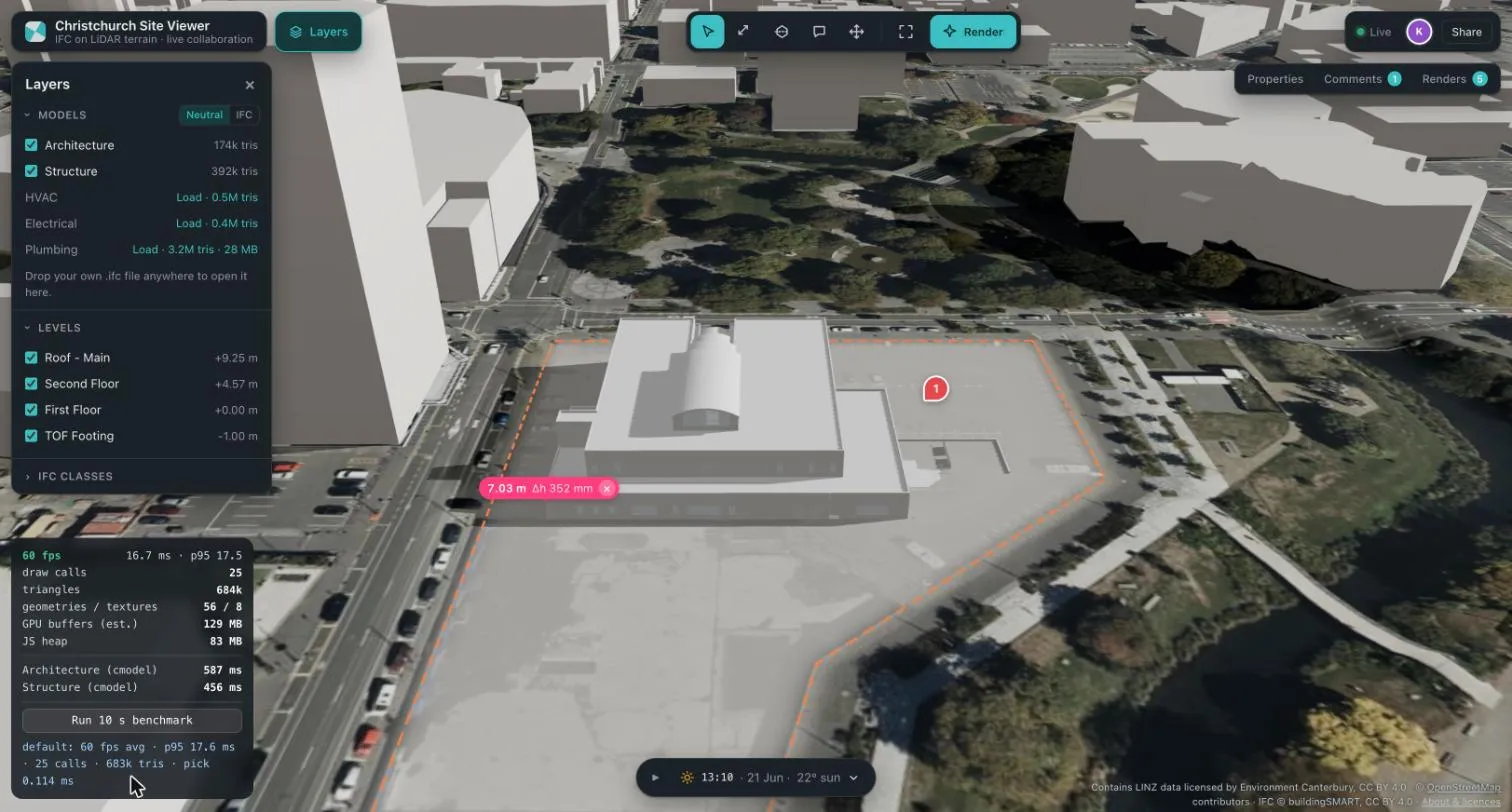
The built-in performance panel (the backtick key) after a 10-second benchmark run on the live demo.
Test setup. A MacBook with Apple M3 (integrated GPU), Chrome, Retina screen. A built-in 10-second benchmark orbits the camera around the site, then fires 300 picking rays. Every variant is a URL flag on the same build. All numbers come from one machine: indicative, not lab-grade.
1. Draw calls, not triangles, were the bottleneck
The naive approach is the obvious one: one mesh per IFC element and per building. For two models and the surrounding city that is 7,811 draw calls per frame. At that count the CPU-side WebGL overhead alone eats the frame budget, regardless of how many triangles there are.
The fix was to merge each model into at most two meshes (opaque and transparent) and keep per-element identity elsewhere:
- every vertex carries an
elemattribute (the element index); - visibility, selection and hover live in a small RGBA8 data texture, one texel per element, read in the vertex shader with
texelFetch.
Hiding a storey or highlighting a wall now means uploading a few kilobytes of texture, never rebuilding a buffer. The context buildings use the same trick. Draw calls went from 7,811 to 26, and the frame rate from 19.6 to 49.6 fps. This single change was the biggest win.
2. Terrain LOD with skirts
The 1.2 × 1.2 km terrain is split into 6 × 6 chunks of 200 m, each a THREE.LOD with vertex strides of 1, 2, 5 and 10. Skirts hide the cracks between levels, and normals are computed with central differences over the whole height field, so the seams between chunks shade correctly.
3. Stop paying for pixels you can’t see
On a Retina laptop, a device-pixel ratio of 2 means 1.78× the pixels of 1.5. Once the scene was cheap in vertices, the integrated GPU was fill-rate bound: the same scene at DPR 1 ran at a locked 60 fps.
Capping DPR at 1.5 and dropping to 1 only while the camera moves (drei <AdaptiveDpr />, triggered from the camera-controls update event) keeps motion smooth and still images sharp. Full resolution comes back about 250 ms after the camera stops.
4. A shadow map that renders only when something changes
The sun only moves when someone changes the time of day. So shadowMap.autoUpdate = false, and the 4096² shadow map is re-rendered only when the sun, the section plane, visibility, placement or the loaded models change. That removes a full extra pass over about 0.6 M shadow-casting triangles from every frame, and takes the draw calls from 26 down to 23.
Together with adaptive DPR and tighter terrain LOD, the default scene reaches 60 fps with a p95 frame time of 17.7 ms, down from 59.7 ms. It still holds 60 fps with all five discipline models loaded: 4.75 M triangles in 28 draw calls.
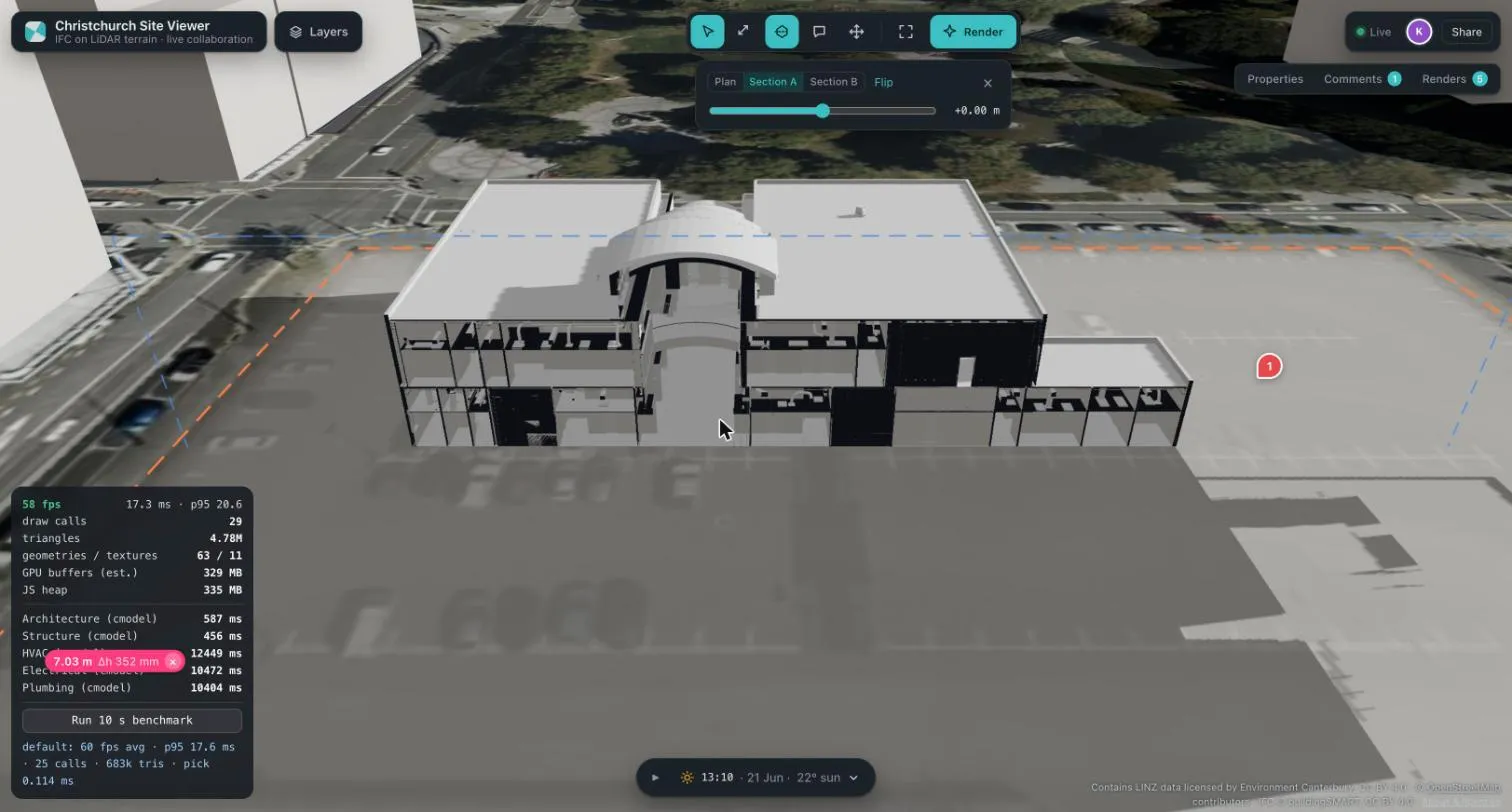
Architecture, structure, HVAC, electrical and plumbing loaded at once, with a section cut through the building.
A small bonus: the section plane needs no extra pass. Clipping uses native clippingPlanes, and the cut is filled by colouring back faces flat in the fragment shader (!gl_FrontFacing). It is a cheap poché instead of stencil caps.
5. Picking: from 7 ms to 0.075 ms
Brute-force Mesh.raycast against 566 k triangles took 7.16 ms on average (33 ms at p95), which you notice on every mouse move. With three-mesh-bvh it takes 0.075 ms, about 95× faster.
The BVH is built in a Web Worker right after decoding, serialised and transferred zero-copy, so the main thread never pays for it. Hover picking runs at most once per animation frame.
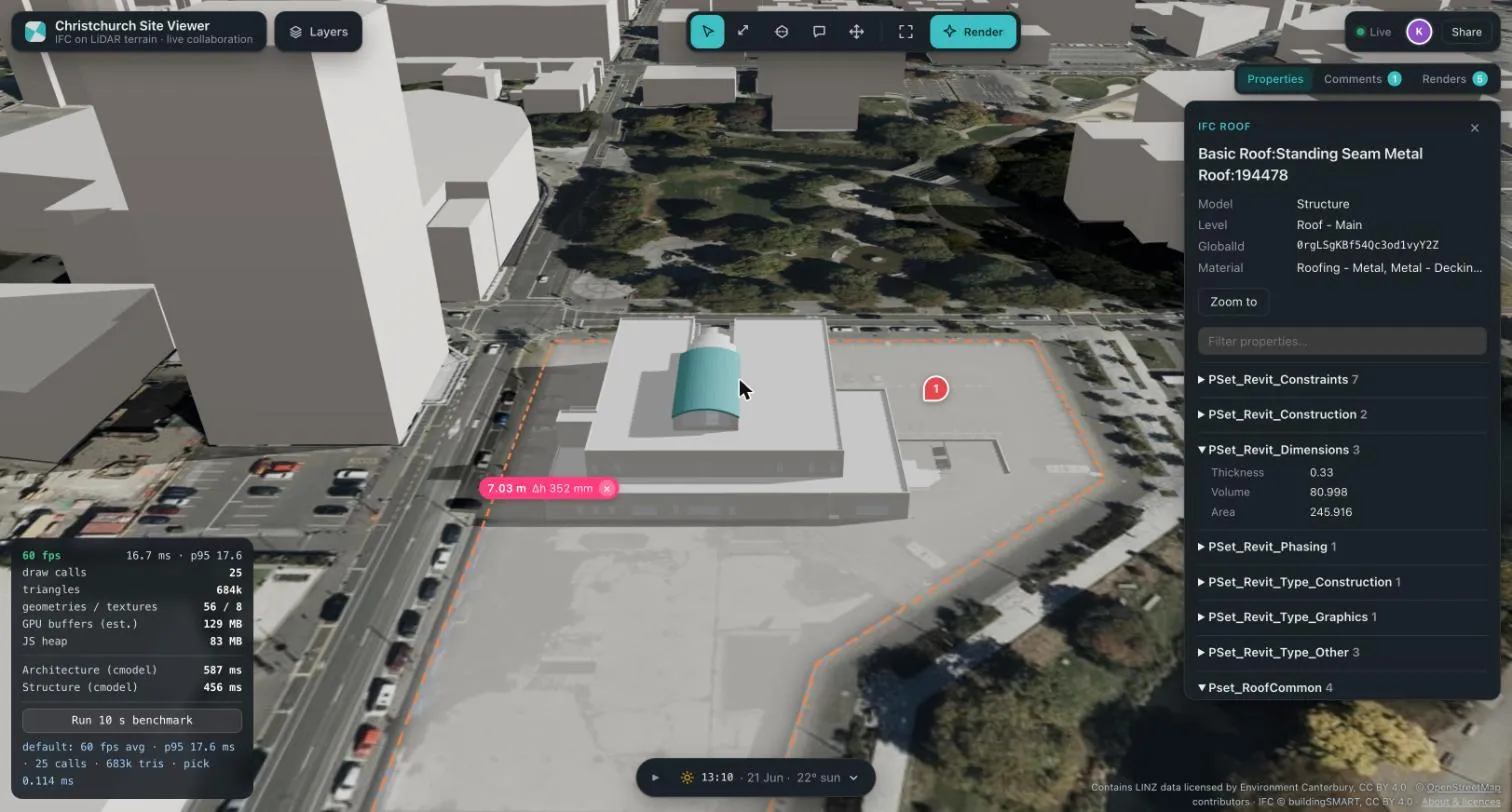
One click picks a single element out of the merged mesh. Its properties are fetched only at that moment.
6. Loading: 32 MB → 2.2 MB before the first view
IFC is a text format. Parsing it in the browser needs web-ifc (about 3.5 MB of JavaScript plus 1.3 MB of WASM) and roughly a second of CPU per model. For the demo models, a build script pre-converts each IFC file into a compact binary:
- convert with the same code the browser uses;
- weld duplicate vertices (−15–36%);
- reorder for the vertex cache;
- encode each attribute stream with meshoptimizer codecs, then gzip.
Normals are stored as snorm8 and colours as unorm8 (22 bytes per vertex instead of 40). Element properties go into a JSON side-car that is fetched only when someone first clicks an element.
The initial view now downloads 2.2 MB instead of 32.1 MB (−93%), and both models are on screen in 0.93 s from a local production build. The worker chunk loaded on startup dropped from 3.7 MB to 197 KB, because web-ifc is now loaded only when someone drops in a real IFC file.
| Metric | Before | After |
|---|---|---|
| Draw calls | 7,811 | 23 |
| Orbit frame rate | 19.6 fps | 60 fps |
| p95 frame time | 59.7 ms | 17.7 ms |
| Picking (average) | 7.16 ms | 0.075 ms |
| First-view download | 32.1 MB | 2.2 MB |
| Worker chunk on startup | 3.7 MB | 197 KB |
What I’d do next
- KTX2/Basis textures for the aerial image. It takes about 89 MB of the 129 MB of GPU memory in the default scene, more than both IFC models together.
- Simplified LOD and per-storey culling for MEP models: the plumbing model is 3.2 M triangles of pipes that are sub-pixel at site scale.
frameloop="demand", so an idle viewer renders nothing.- Streamed terrain tiles to go beyond a 1.2 km square.
Takeaways
- Measure first. A scripted, repeatable benchmark with a URL flag for each variant made every decision a comparison, not a guess.
- In WebGL, draw calls usually hurt before triangles do. Merge geometry and move per-object state into textures.
- On laptops, the GPU is often fill-rate bound. Resolution is a performance setting, not just a quality one.
- Ship what the user needs first. Pre-processing and lazy loading beat clever parsing at runtime.
You can open the live demo and press the backtick key to see the same panel and run the benchmark yourself, or read more about the project on its project page.