Fleet Operations Replay
A browser dispatcher demo that replays a simulated delivery day for 64 vans and trucks on the real street network of central Auckland, with KPIs, an exceptions queue and live team collaboration.
Designed and built by me.
- WebLive
What it does
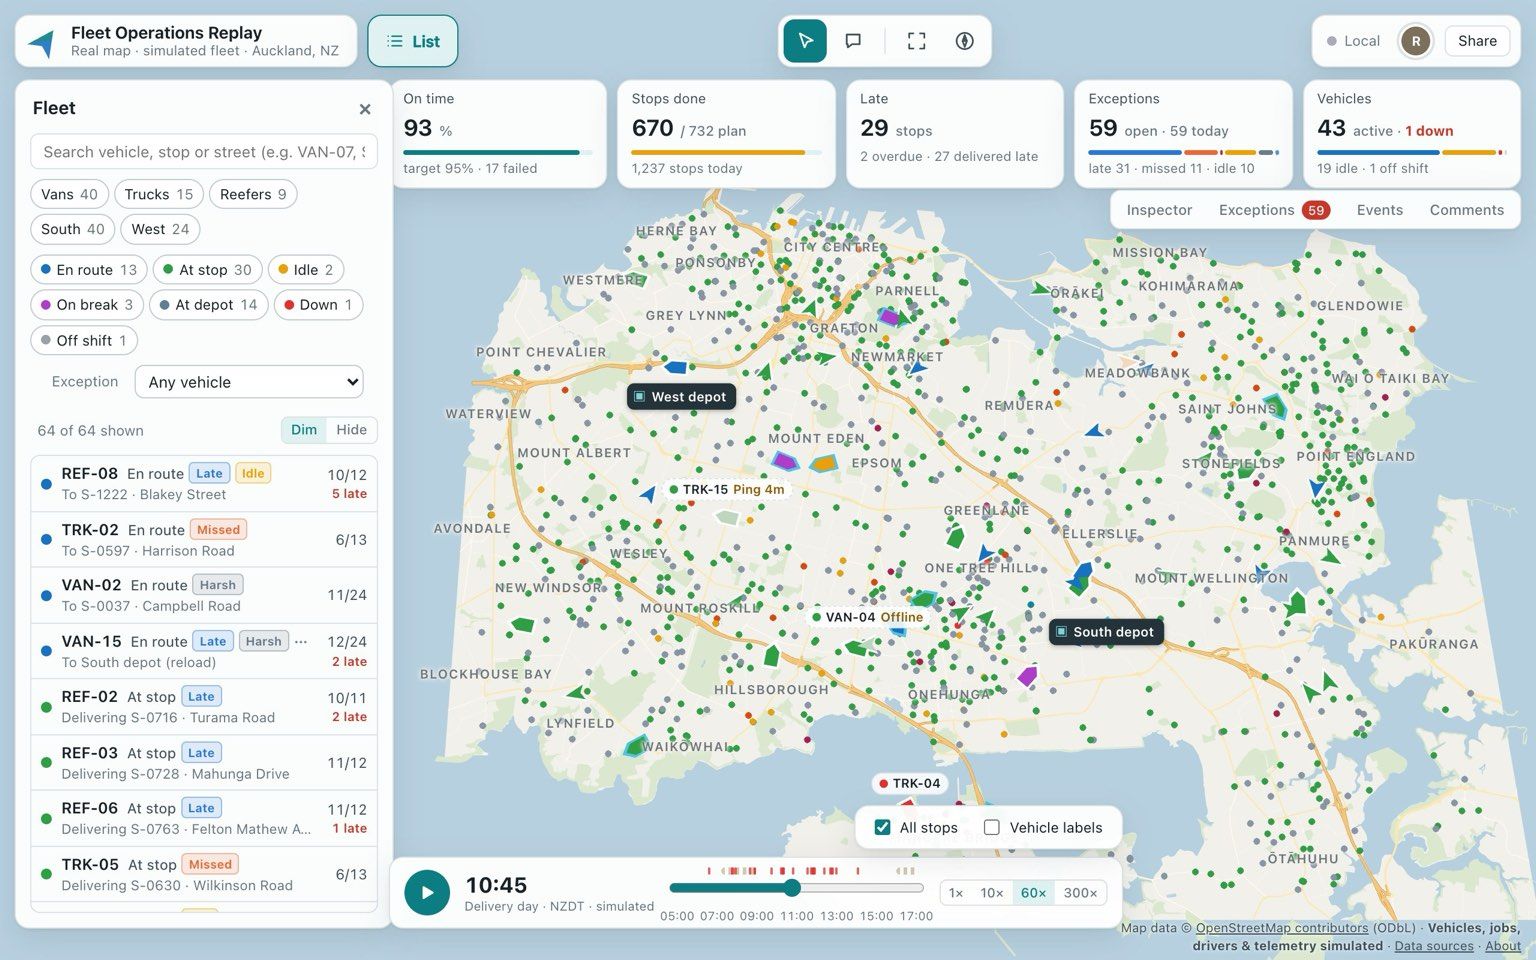
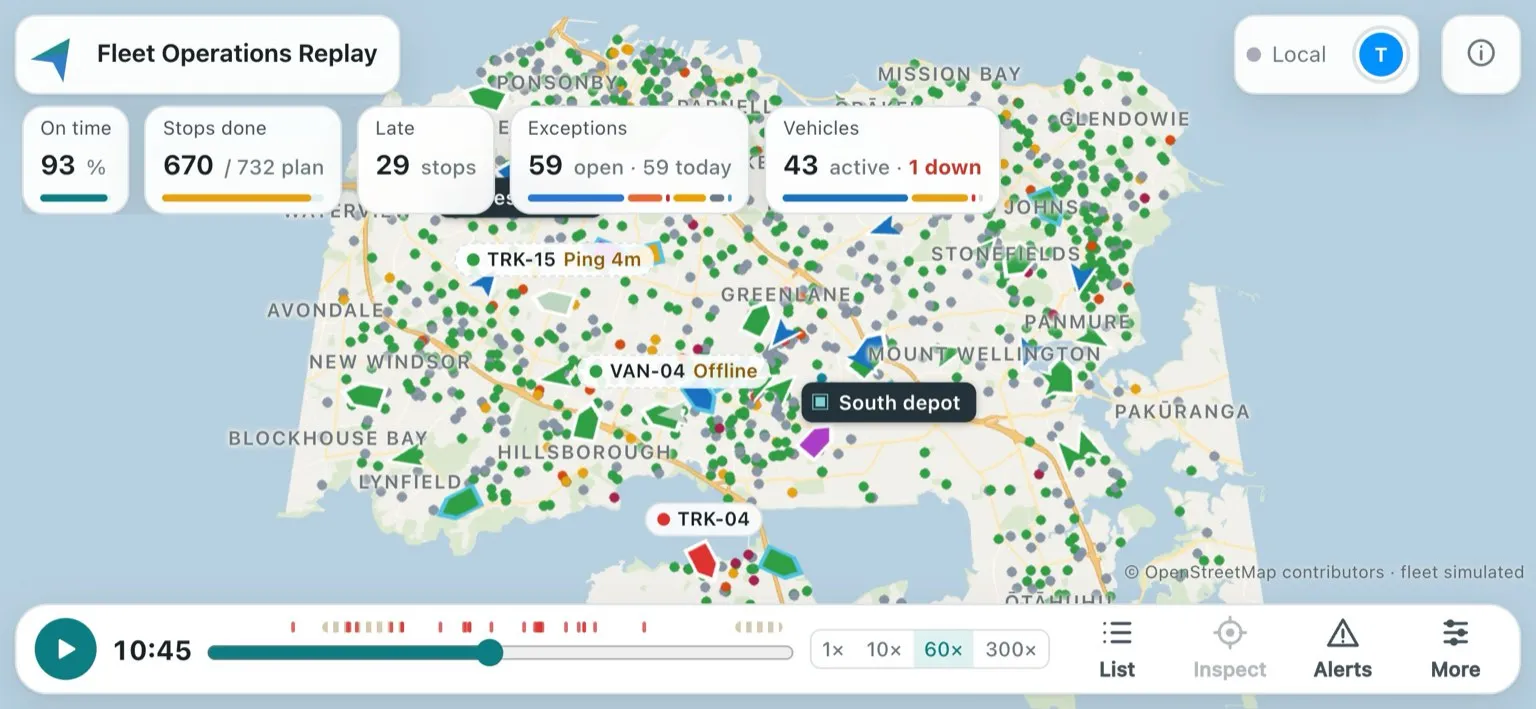
Fleet Operations Replay is an independent browser demo of dispatcher UX for last-mile and regional delivery. It replays a simulated delivery day for 64 vehicles on the real street network of central Auckland, New Zealand: 40 vans, 15 rigid trucks and 9 refrigerated trucks working from two depots.
Open the live demo (opens in a new tab). To see the shared exceptions queue, open the same link in a second tab.
The day runs from 05:00 to 17:00. There are 1,237 customer stops with delivery windows and two trips per run, AM and PM traffic peaks, failed deliveries, two breakdowns, a reefer compressor fault, harsh braking and idle time. Drivers take rest breaks under a generic, clearly simulated rule: 30 minutes after 5.5 hours of work.
The telemetry is deliberately messy: GPS gaps (the vehicle is shown at its last fix), late pings, a dead telematics device whose deliveries still arrive through the driver app, and an odometer glitch.
- Map. A top-down 2.5D map drawn with three.js from an OpenStreetMap package. Road widths follow the zoom.
- KPI strip. On-time %, stops done against plan, late stops, open exceptions by type, and vehicles active, idle and down.
- Fleet list. Filters synced with the map.
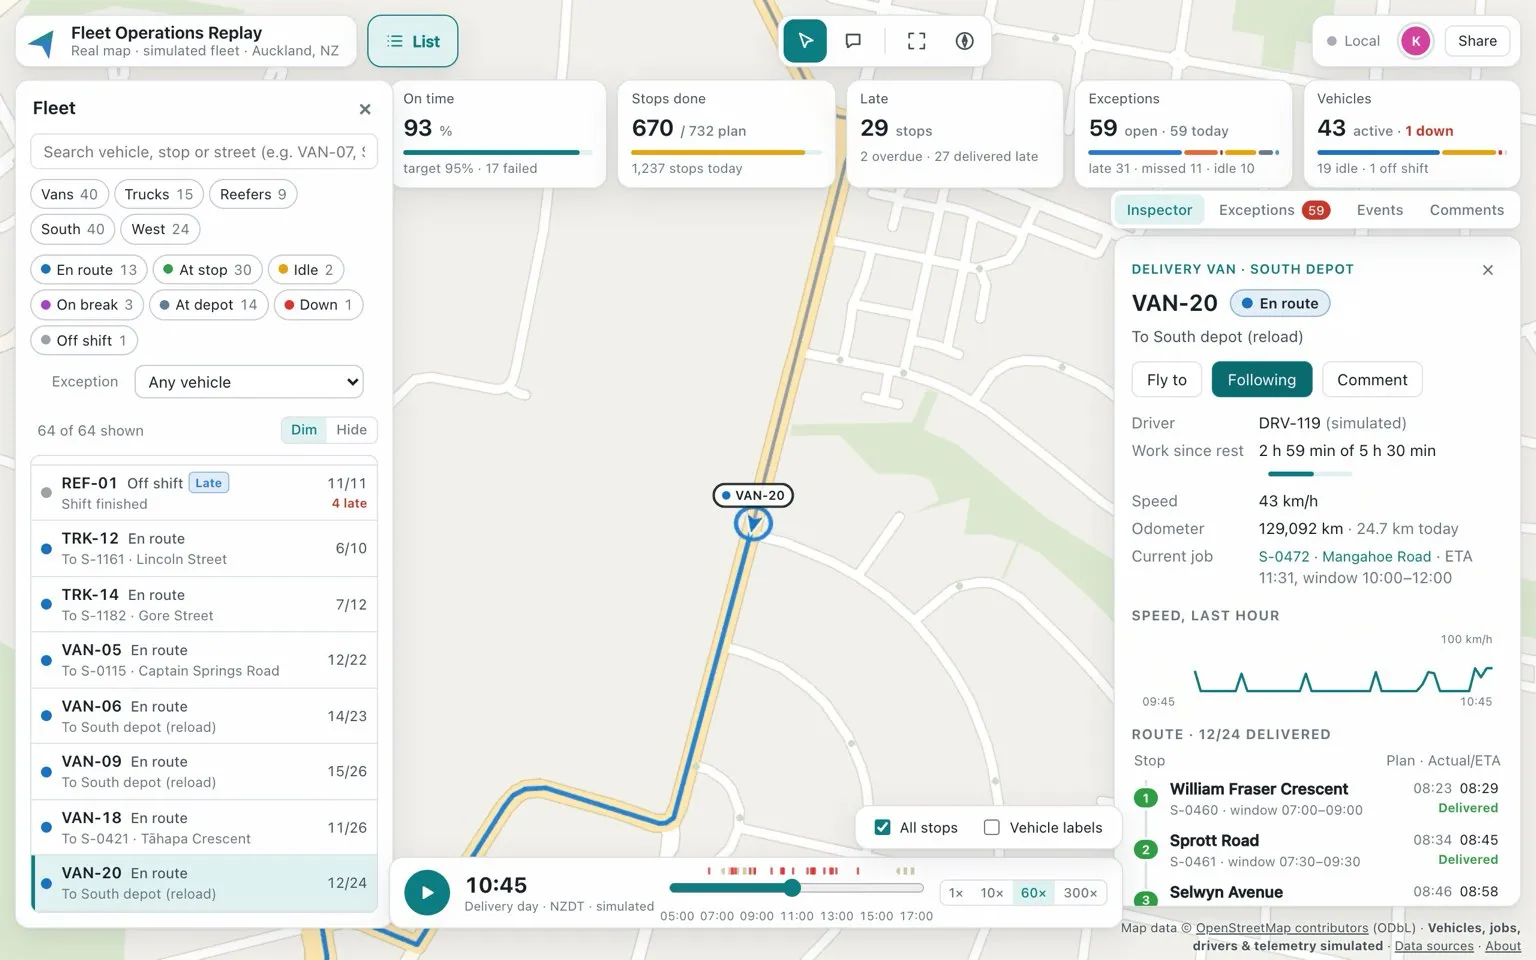
- Vehicle inspector. A route timeline with planned and actual ETA, a speed trace, events and Follow.
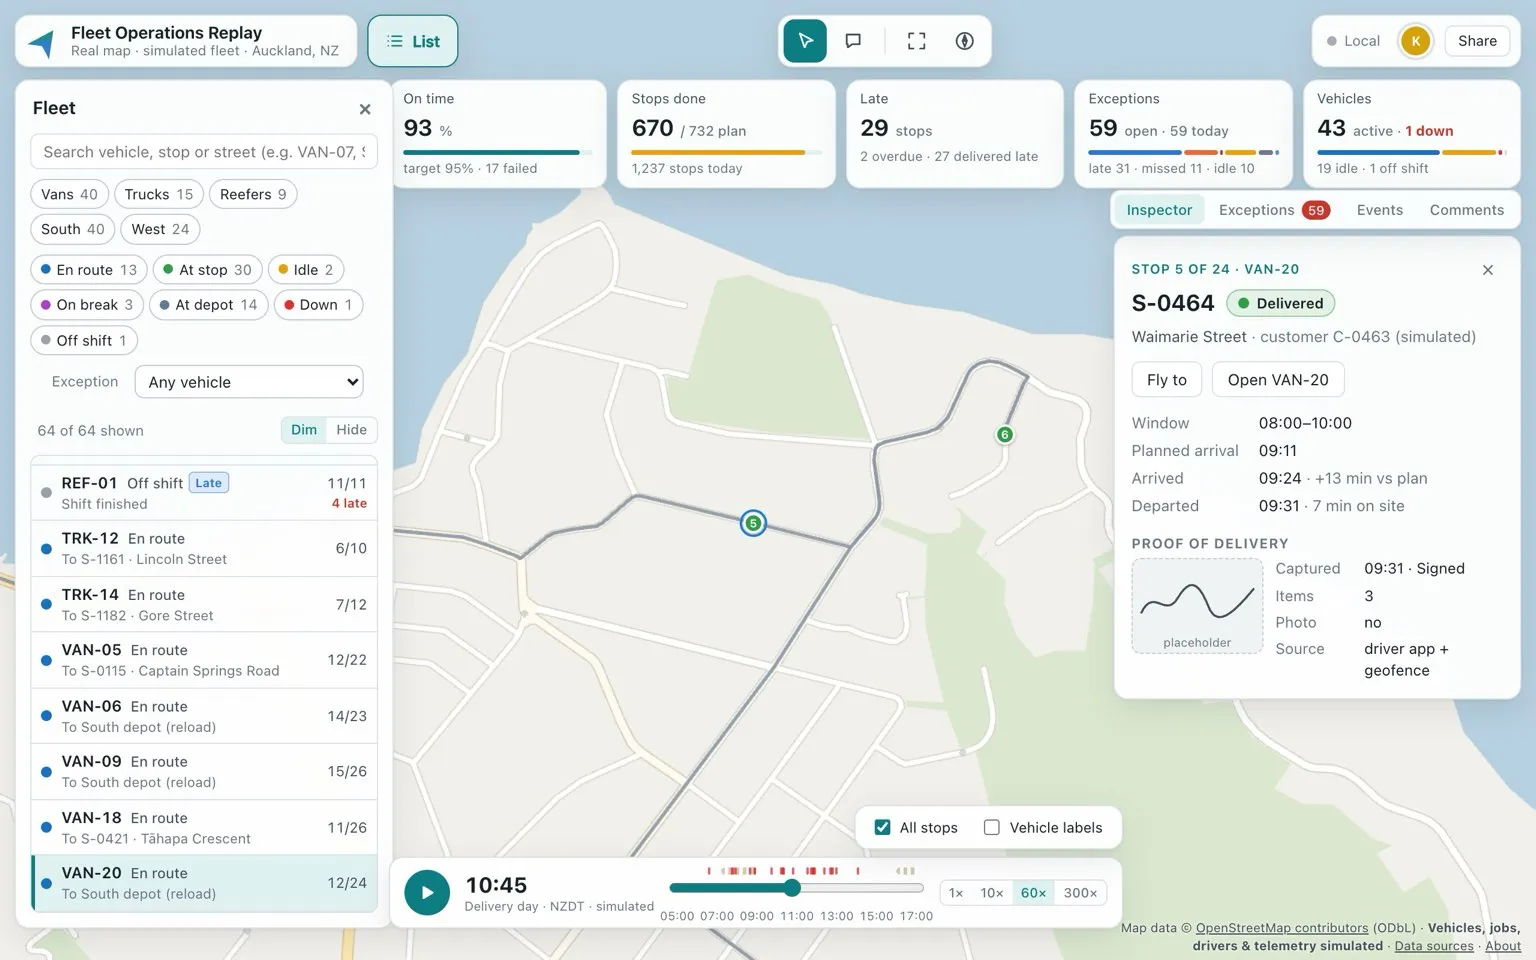
- Stop inspector. The delivery window, ETA, status and a proof-of-delivery placeholder.
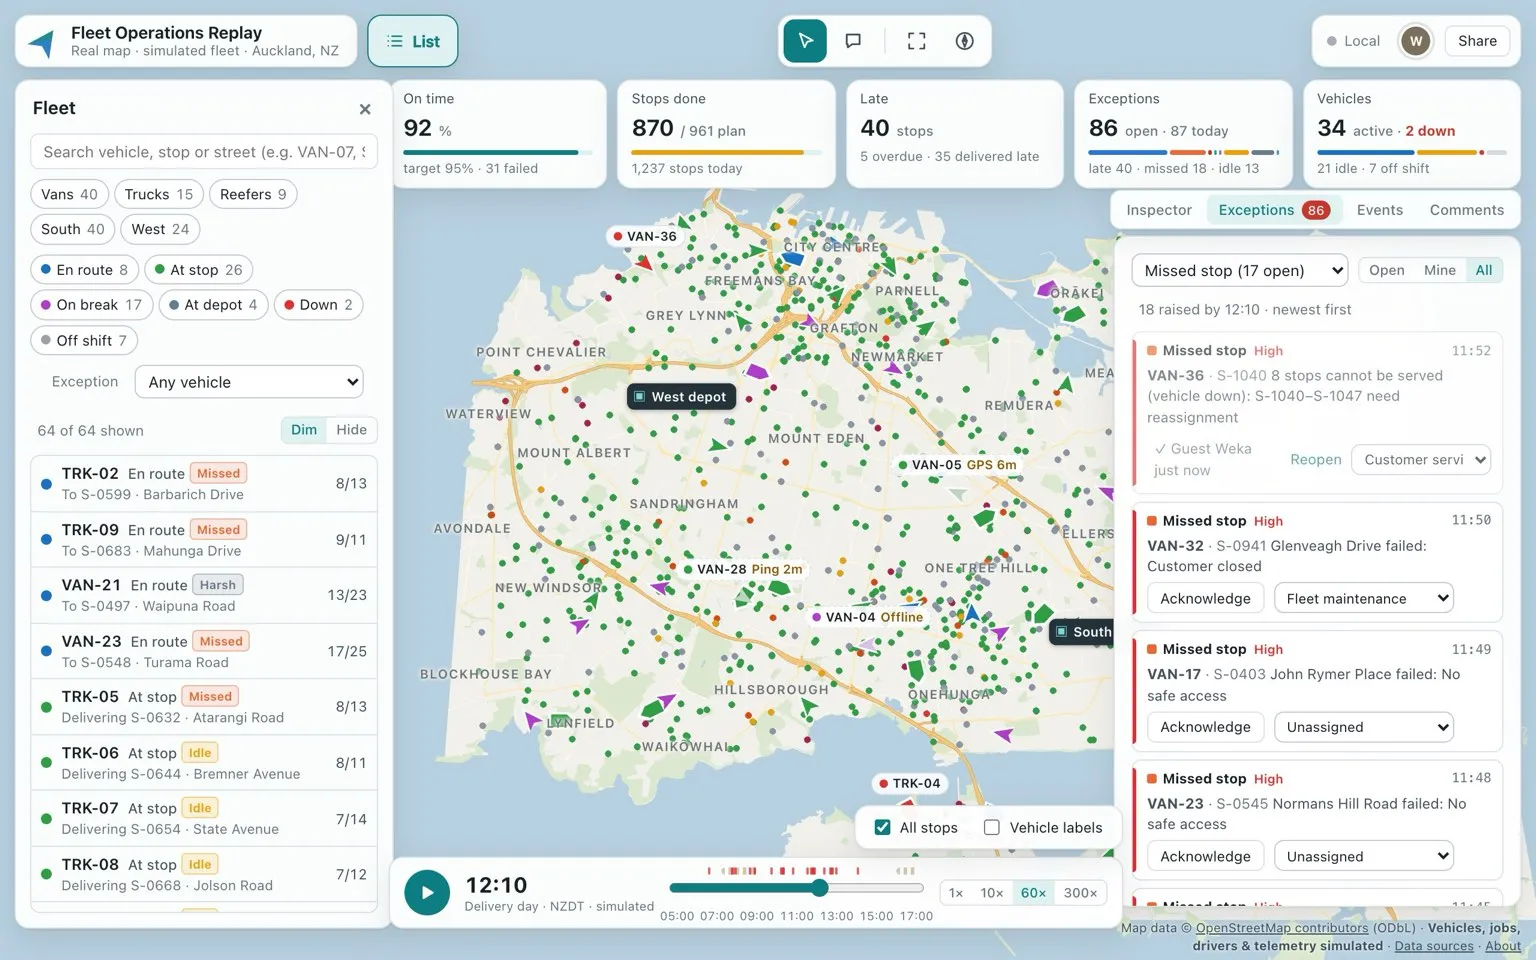
- Exceptions queue. A team works it together: exceptions are acknowledged and assigned, shared live over Yjs WebSockets.
- Comments pinned to vehicles and stops.
- Replay at 1×, 10×, 60× and 300×, with scrubbing.
- URL flags:
?t=HH:MMto open a moment of the day,?vehicles=500for a stress test, and?stats. - Phone layout in landscape.
Key decisions
Routes precomputed at build time. Routes were computed with A* on the OpenStreetMap road graph, using travel time, one-way streets and speed classes. The browser only downloads compact binary packages.
A deterministic day. The whole day is simulated in the browser from fixed seeds, and unit tests check determinism and invariants. Every visitor sees the same day, so a timestamp is enough to share a moment.
Data problems are not operational problems. The UI keeps the two apart: a late ping is not a breakdown.
How it is built
The front end is React and TypeScript with Vite, three.js through React Three Fiber, and Zustand for state. The shared exceptions queue runs on Yjs over WebSockets, served by a Node WebSocket server. Everything runs in Docker behind Caddy. Data preparation is written in TypeScript and pulls OpenStreetMap data through Overpass.
It was built with AI coding agents working from written specs, unit tests and headless-browser checks of every screen.
Performance
Measured in headless Chromium on an Apple M3, at 1280×800 and a device pixel ratio of 2.
| Metric | Result |
|---|---|
| Frame rate, 64 vehicles | 60 fps, paused or at 300× |
Frame rate, ?vehicles=500 |
60 fps paused, 58.8 fps playing at 300× |
| Draw calls | 14, regardless of fleet size |
| First view | 0.70 MB transferred in 6 requests |
| Whole-day simulation | 12–31 ms in the browser |
Current state
A live demo, built in November 2026. It is an independent, self-initiated project, and the source code is not public.
Data and disclaimer
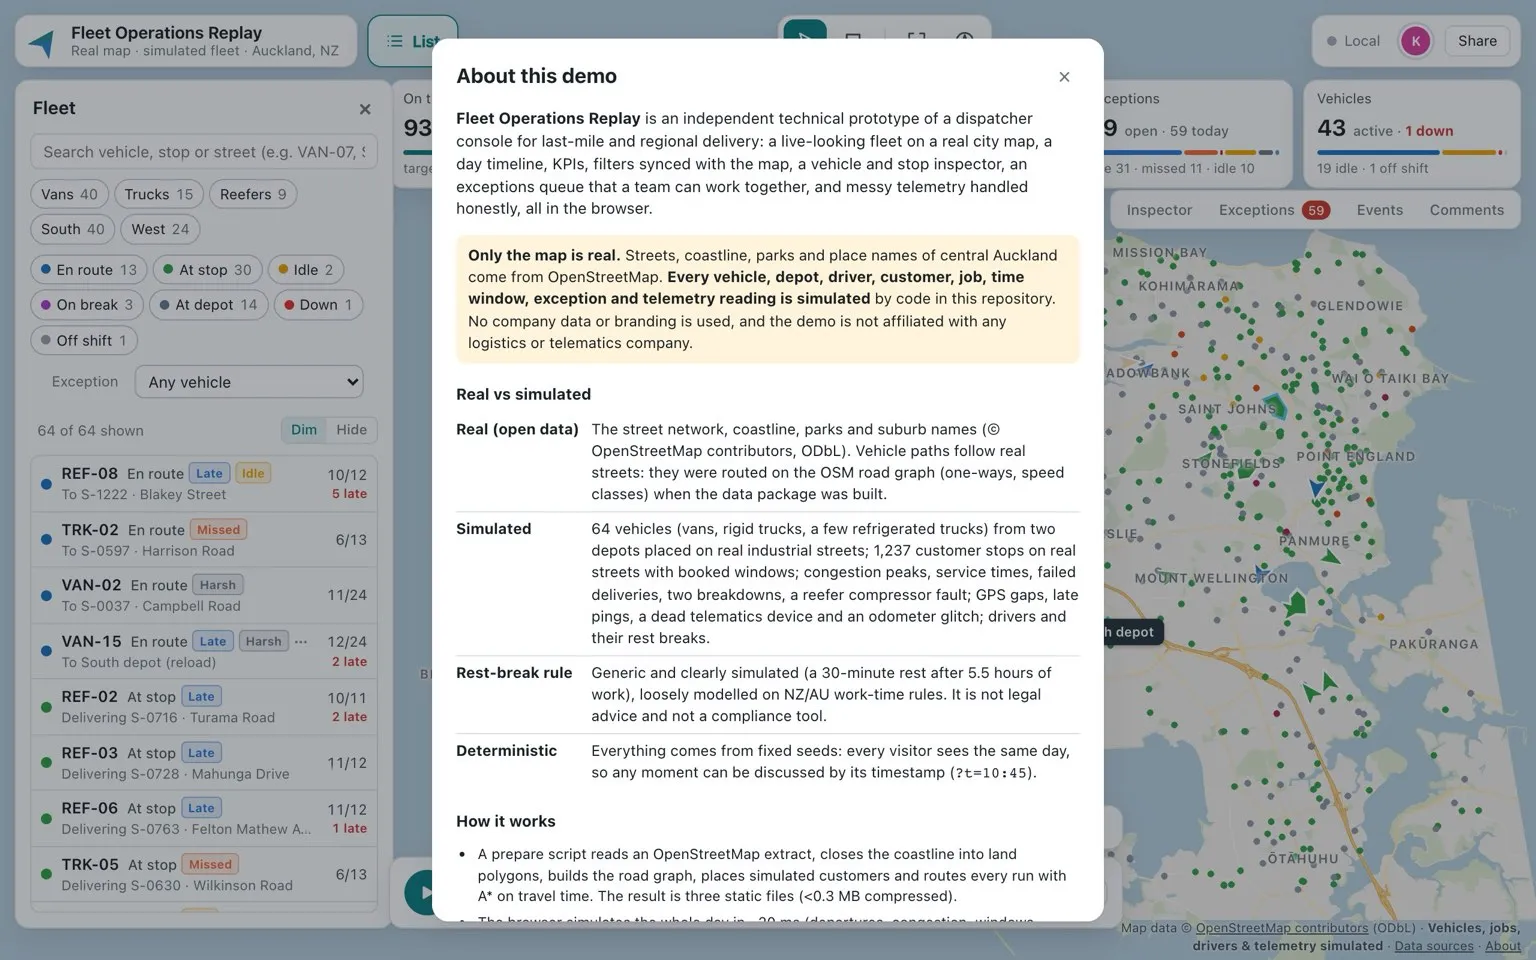
- Map data © OpenStreetMap contributors (ODbL).
Only the map is real. All vehicles, depots, drivers, customers, jobs and telemetry are simulated. Not affiliated with any logistics or telematics company.
Details
- Platforms
- Web — live
- Role
- Designed and built by me.
- Category
- Maps & data
- Built with
- TypeScript, React, three.js, Node.js
- Website
- pixelbrisbane.com
More projects
All projectsPixel Brisbane
An interactive isometric map of Brisbane, combining buildings, places and useful city data.
- WebLive
Christchurch Site Viewer
A browser 3D prototype that places an IFC building on a real Christchurch site, with LiDAR terrain, review tools, live collaboration and AI renders.
- WebLive
Built with TypeScript · React · three.js
Mine Operations Viewer
A browser 3D operations demo for open-pit mining: a simulated 12-hour shift of 39 vehicles on real terrain and satellite imagery around Kalgoorlie, with a geology view.
- WebLive
Built with TypeScript · React · three.js