Mine Operations Viewer
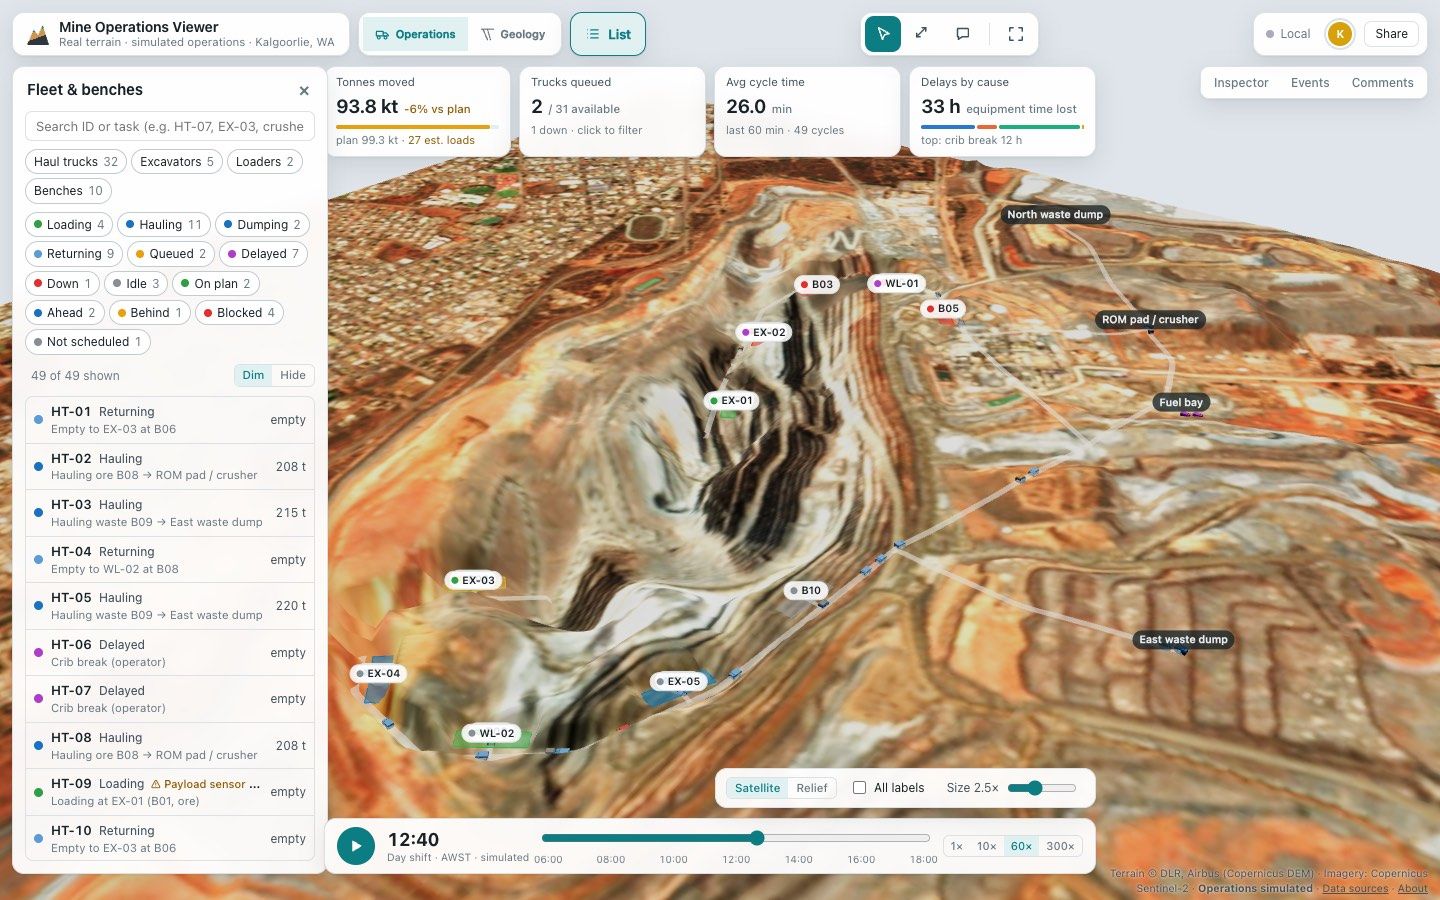
A browser 3D operations demo for open-pit mining: a simulated 12-hour shift of 39 vehicles on real terrain and satellite imagery around Kalgoorlie, with a geology view.
Designed and built by me.
- WebLive
What it does
Mine Operations Viewer is a browser 3D operations demo for open-pit mining. It uses real terrain and satellite imagery around Kalgoorlie, Western Australia (Copernicus DEM and Sentinel-2), with a simulated 12-hour shift on top.
Open the live demo (opens in a new tab).
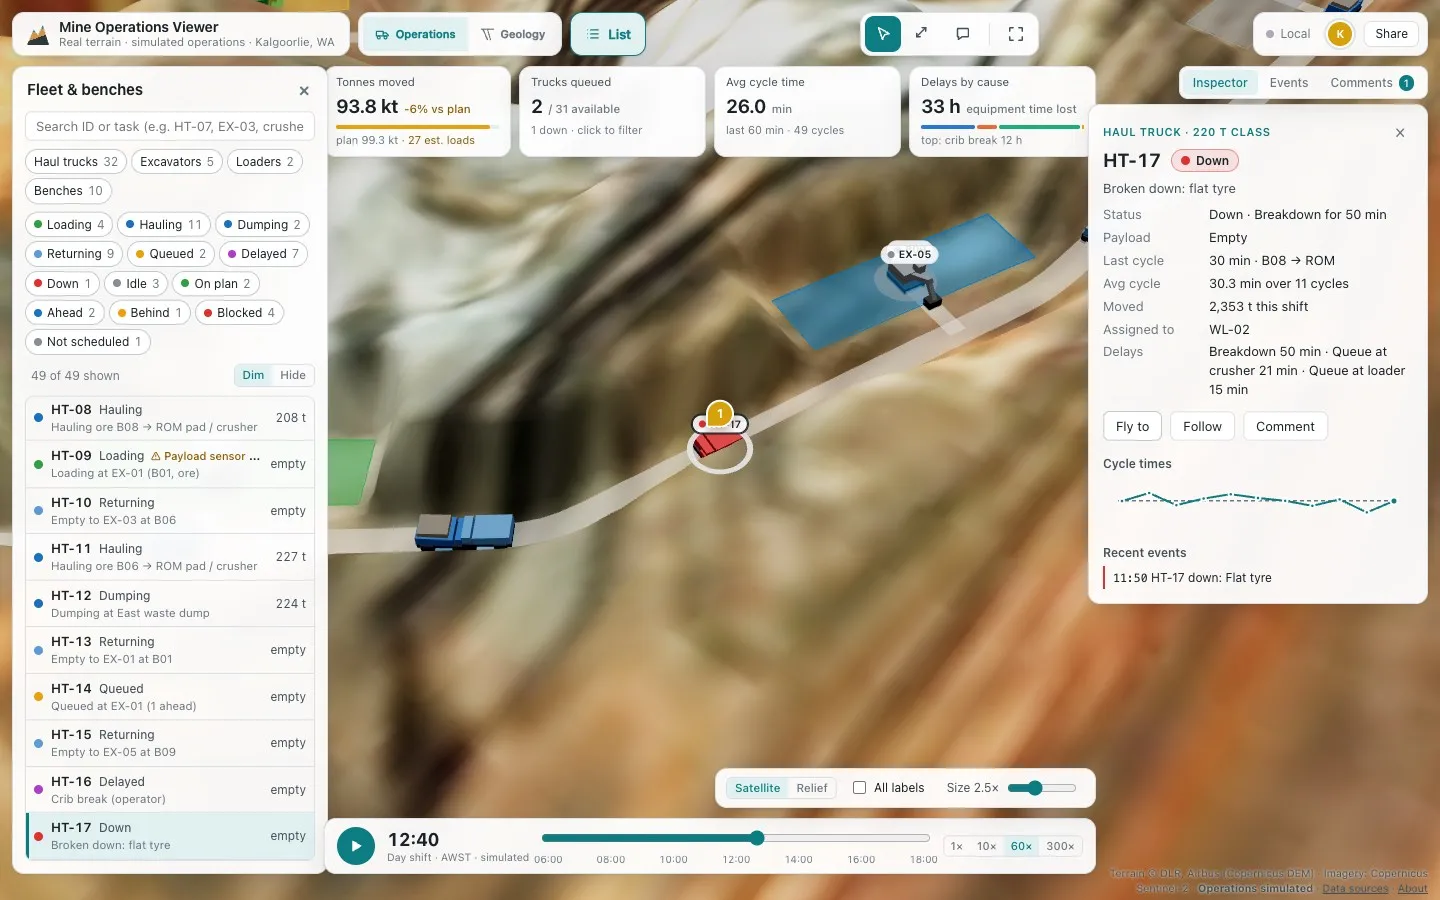
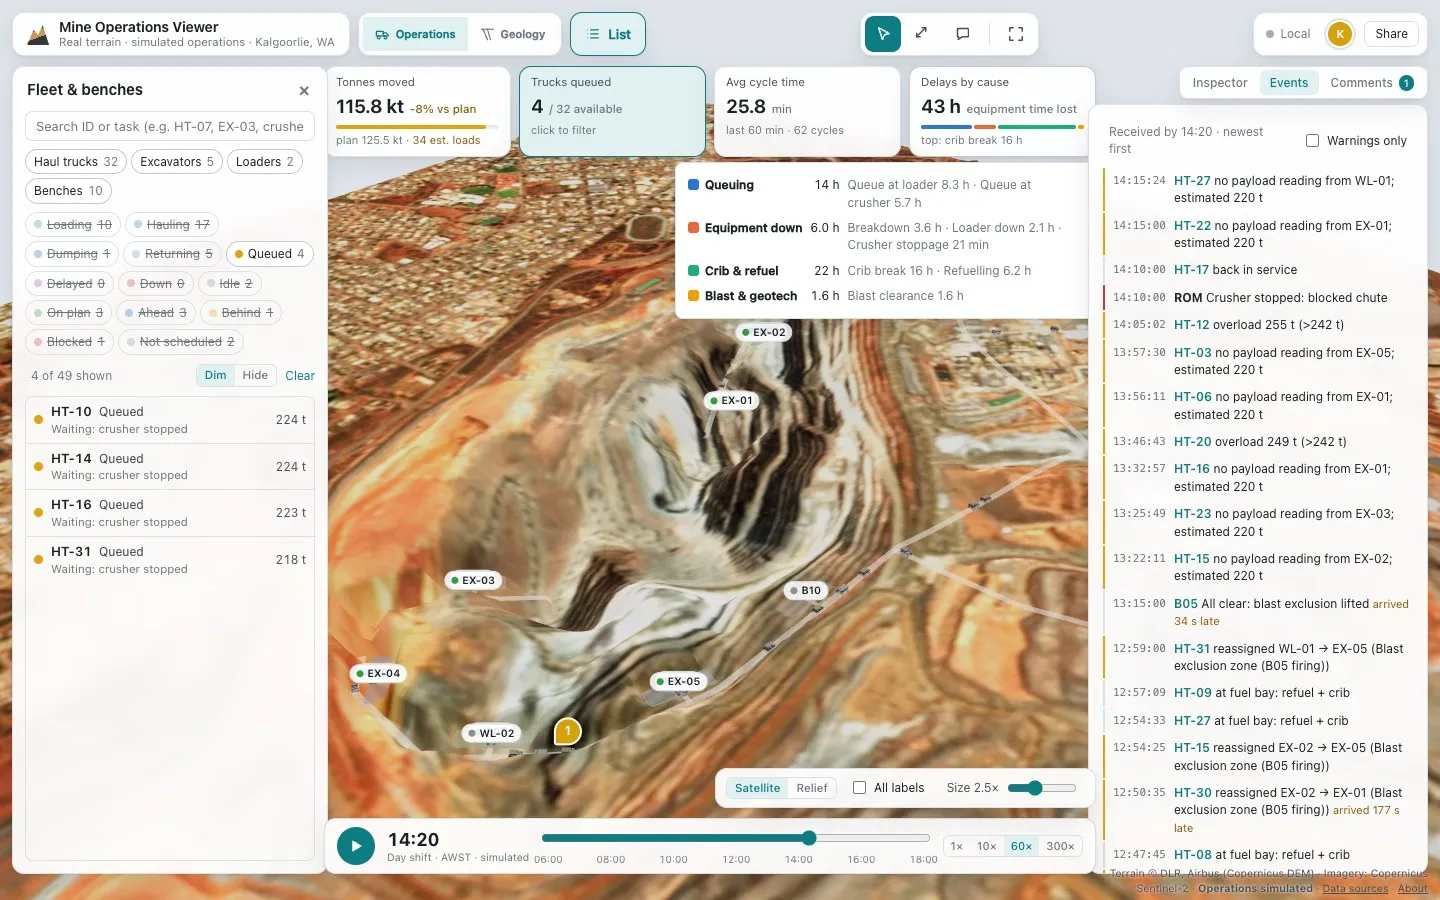
The shift has 39 vehicles running load–haul–dump cycles, with queues, breakdowns and delays. The data is messy on purpose: GPS dropouts, a failed payload sensor and late events.
- Bench plan against actual, and a KPI strip.
- Truck histories and an event log.
- Timeline replay.
- An inspector and filters linked with the 3D scene.
- Comments on equipment.
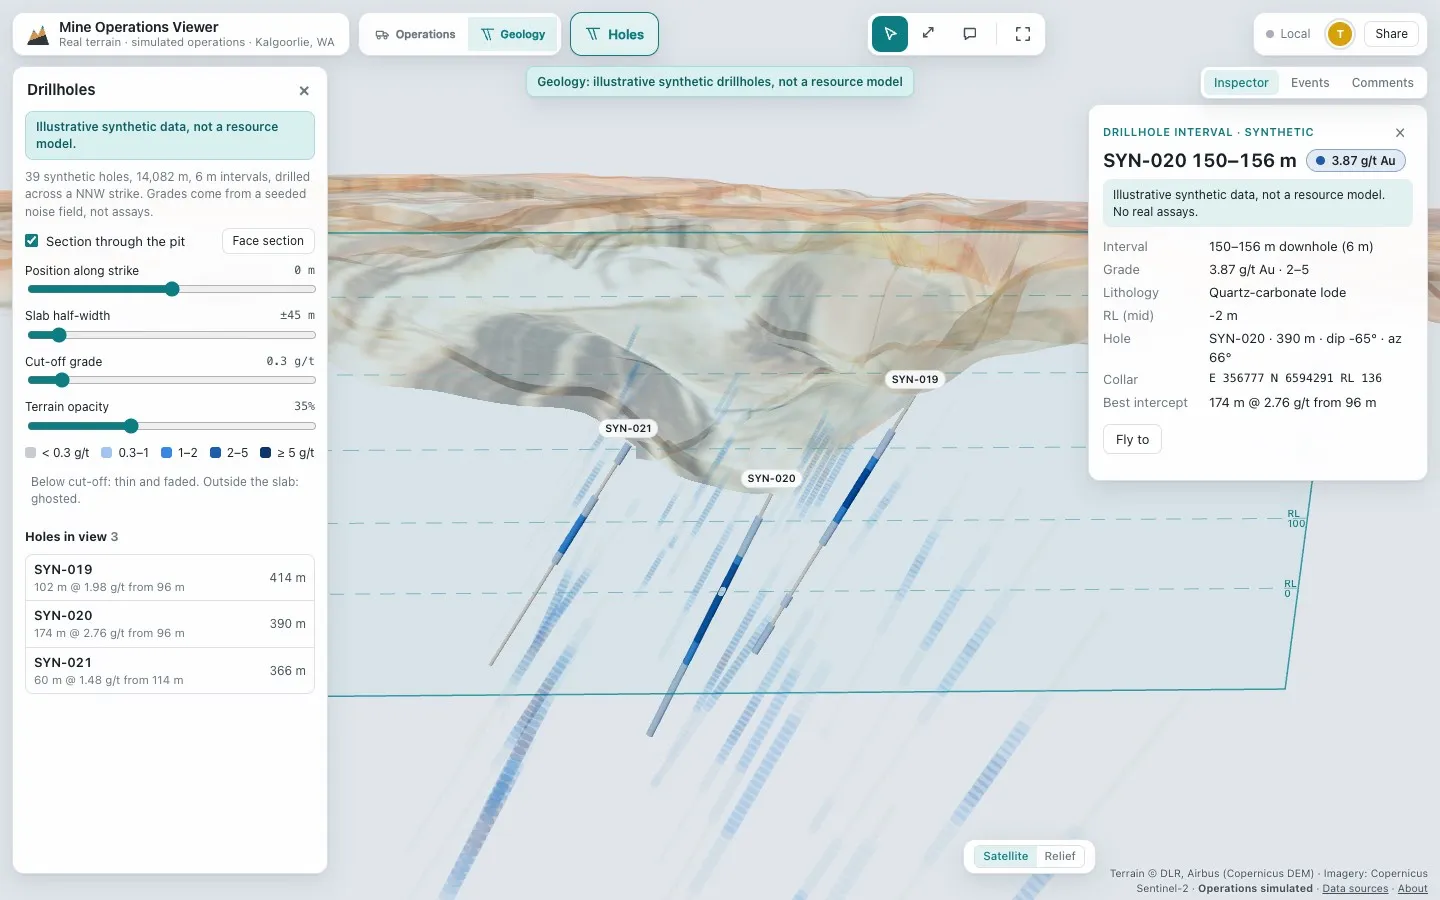
- A geology view with synthetic drillholes, grade intervals and a section plane.
How it is built
React and TypeScript, three.js through React Three Fiber, Zustand for state, and Yjs.
Performance
- 60 fps with 400 instanced trucks in a stress test.
- 35 draw calls.
- 0.8 MB initial download.
Current state
A live demo, built in November 2026. It is an independent, self-initiated project, and the source code is not public.
Data and disclaimer
All operational and geological data is synthetic. Only the terrain and imagery are real (Copernicus DEM, Sentinel-2). Not affiliated with any mine owner.
Details
- Platforms
- Web — live
- Role
- Designed and built by me.
- Category
- Maps & data
- Built with
- TypeScript, React, three.js
- Website
- pixelbrisbane.com
More projects
All projectsPixel Brisbane
An interactive isometric map of Brisbane, combining buildings, places and useful city data.
- WebLive
Fleet Operations Replay
A browser dispatcher demo that replays a simulated delivery day for 64 vans and trucks on the real street network of central Auckland, with KPIs, an exceptions queue and live team collaboration.
- WebLive
Built with TypeScript · React · three.js
Christchurch Site Viewer
A browser 3D prototype that places an IFC building on a real Christchurch site, with LiDAR terrain, review tools, live collaboration and AI renders.
- WebLive
Built with TypeScript · React · three.js